William Playfair, the uncredited mastermind behind pie charts and bar graphs
The father of data visualization, William Playfair, altered our perception of information. Even though his name is hardly remembered, his line graphs, pie charts, and bar graphs are still vital tools today.
Today, information is ubiquitous. Pie charts and bar graphs are now such a fundamental part of information presentation that it is hard to imagine a world without them. Businesses, from small companies to billion-dollar enterprises, rely on data analysis. Valued at more than $200 billion, the global data analytics industry is growing rapidly.
Yet, William Playfair, a Scotsman who passed away over 200 years ago, made statistics easy to read long before there were AI dashboards and Excel spreadsheets. His name is not well-known, even though his creations—bar graphs, line charts, and pie charts—are used daily. Playfair was an inventor, economist, revolutionary, and sometimes even a confidence trickster. His story is as colorful as his charts.
Early Life
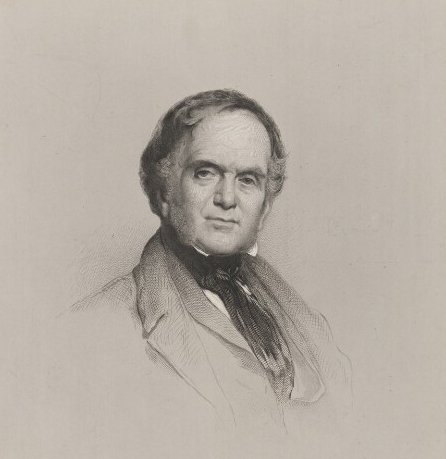
Playfair was born on September 22, 1759, in Scotland and grew up in an educated family. He was the fourth of four brothers, all of whom were successful professionals.
When his father died, his older brother, mathematics professor John Playfair, continued his education and instilled in him a mathematical background that would later influence his creative work.
William Playfair adopted experiential learning instead of the more conventional academic path. Playfair served as an apprentice to Andrew Meikle, the inventor of the threshing machine, without going to a university. He then worked for the steam engine pioneer James Watt.
By the time he was 22 years old, Playfair had already been granted a patent for a machine that enhanced the accuracy of rolling flat steel sheets. His creativity earned him multiple patents, among which was a patent for metal plating, which formed the basis for modern applications like electroplating.
But he was more concerned with understanding economic rather than just mechanical patterns. Or perhaps that wasn’t his “true” interest because he dabbled in and excelled at so many various pursuits that it doesn’t seem human.
HOW BAR AND PIE CHARTS WERE INVENTED BY PLAYFAIR
Most of the presentations of data in the 18th century were tables of numbers. Playfair considered this to be ineffective. He was inspired by how maps could be used to explain geography and questioned whether numbers could similarly be presented artistically.
Therefore, the initial bar graph and line chart were presented in his book The Commercial and Political Atlas (1786). These tools were employed by Playfair to present trade statistics between England and its trading partners instead of dry tables.
Without requiring lengthy descriptions, his graphs immediately revealed economic trends. These tools made complex economic information easily understandable so that readers could easily identify patterns.
While these advances were revolutionary, not all people at the time appreciated them. His methods were considered unscientific by most academics. Nearly a century would elapse before Playfair’s charts became popularized.
A LIFE OF ADVENTURES AND RISKS
William Playfair led a highly diverse professional life since he took chances and explored different professions. Engineer, draftsman, accountant, inventor, silversmith, merchant, investment broker, economist, statistician, pamphleteer, translator, publicist, land speculator, banker, editor, and journalist were some of the numerous positions that he tried his hand at.
Once he moved to France in 1787, he soon became involved in the French Revolution. Two years thereafter, he actually participated in storming the Bastille!
By this secret scheme, the assignat had made the assignat valueless in 1795. Though having the temerity, he had to head back to England since it was illegal.
His own finances were just as shaky. He struggled financially and was often in debt, in spite of having good ideas. He was usually jailed for crimes related to debts; there are records that prove he was arrested at Fleet Prison at least four times between the years 1801 and 1813.
It is alleged by some accounts that Playfair attempted to blackmail one of Scotland’s wealthiest individuals, Lord Archibald Douglas, in his old age by challenging his claim to inheritance and legitimacy. This attempt was thwarted, severely tarnishing the reputation of Playfair. These challenges overshadowed his achievements in life.
The Legacy of Playfair in the Modern World
Playfair died on February 11, 1823, and his work remained largely unknown until now. But his charts today are applied to news charts and business reports alike. We owe our ability to easily spot patterns in data to a man who thought numbers should tell us stories, not simply be placed in tables.
Although Flayfair lived a busy life, his ideas remain. Today, whenever we view a pie or bar chart, we are reverberating the almost 200-year-old custom of Playfair’s to make data tell us stories.